Table of Contents
Production Activities as the core
Authorship:Peter Witzke
The economic activities in the agricultural sector are broken down conceptually into ‘production activities’ (e.g. cropping a hectare of wheat or fattening a pig). These activities are characterised by physical output and input coefficients. For most activities, total production quantities can be found in statistics and output coefficients derived by division of activity levels (e.g. ‘soft wheat’ would produce ‘soft wheat’ and ‘straw’, whereas ‘pigs for fattening’ would produce ‘pig meat’ and NPK comprised in manure). However, for some activities other sources of information are necessary (e.g. a carcass weight of sows is necessary to derive the output coefficient for the pig fattening process). For manure output engineering functions are used to define the output coefficients. The way the different output coefficients are calculated is described in more detail below.
The second part characterising the production activities are the input coefficients. Soft wheat, to pick up our example again, would be linked to a certain use of NPK fertiliser, to the use of plant protection inputs, repair and energy costs. All these inputs are used by many activities, and official data regarding the distribution of inputs to activities are not available. The process of attributing total input in a region to individual activities is called input allocation. It is methodologically more demanding than constructing output coefficients. Specific estimators are developed for young animals, fertilisers, feed and the remaining inputs, which are discussed below.
Multiplied with average farm gate prices for outputs and inputs respectively, output coefficients define farm gate revenues, and input coefficients variable production costs. The average farm prices used in the CAPRI data base are derived from the EEA and hence link physical and valued statistics. However, in some cases as young animals and manure which are not valued in the EEA, own estimates are introduced.
In order to finalise the characterisation of the income situation in the different production activities, subsidies paid to production must be taken into account. The CAPRI data base features a rather complex description of the different CAP premiums allocated to the individual activities. However, subsidies outside of the CAP for the EU Member States have received less attention (in line with smaller amounts).
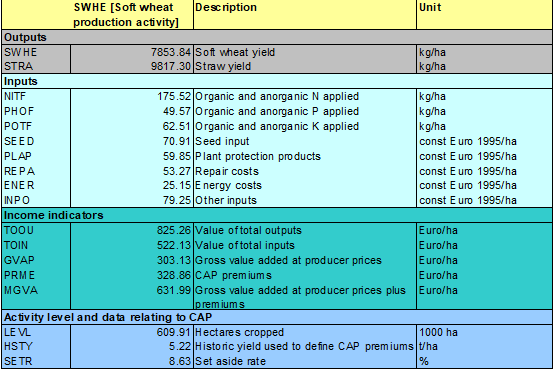
The following table gives an example for selected activity related information from the CAPRI data base.
Table 1: Example of selected data base elements for a production activity

Technology variants for production activities
For most activities there are two technologies available, typically a low and a high yield variety. Usually they are defined to cover each 50% of the activity level observed in ex post data, but with some particularities in the sugar sector (see ‘\sugar\techf.gms’).
Linking production activities and the market
The connection between the individual activities and the markets are the activity levels. Total soft wheat produced is the sum of cropped soft wheat hectares multiplied with the average soft wheat output coefficient. In cases like pig meat, as mentioned before, several activities are involved to derive production.
The produced quantities enter the farm and market balances. Production plus imports as the resources are equal to the different use positions as exports, stock changes, feed use, human consumption and processing. These balances are only available at Member State, not at regional level. Production establishes the link to the EAA as well, as average farm gate prices are unit values derived by dividing the values from the EAA by production quantities.
The three basic identities linking the different elements of the data base are expressed in mathematical terms as following. The first equation implies that total production or total input use (code in the data base: GROF or gross production/gross input use at farm level) can be derived from the input and output coefficients and the activity levels (LEVL):
\begin{equation} GROF_j = \sum_j{LEVL_j \cdot IO_j} \end{equation}
The second type of identities refers to the farm and market balances:
\begin{align} \begin{split} GROF_{io}-SEDF_{io}-LOSF_{io}-INTF_{io} &=NETF_{io}\\ NETF+IMPT_{io} &=EXPT_{io}+STCM_{io}\\ &\quad+FEDM_{io}+LOSM_{io}\\ &\quad+SEDM_{io}+HCOM_{io}\\ &\quad+INDM_{io}+PRCM_{io}\\ &\quad+BIOF_{io} \end{split} \end{align}
The farm balance positions are seed use (SEDF) and losses (LOSF) on farm (only reported for cereals) and internal use on farm (INTF, only reported for manure and young animals). NETF or net trade on farm is hence equal to valued production/input use and establishes the link between the market and the agricultural production activity. Adding imports (IMPT) to NETF defines total resources, which must be equal to exports (EXPT), stock changes (STCM), feed use on market (FEDM), losses on market (LOSM), seed use on market (SEDM), human consumption (HCOM), industrial use (INDM), processing (PRCM), and use for biofuel production (BIOF).
The third identity defines the value of the EAA in producer prices (EAAP) as sold production or purchased input use (NETF) in physical terms multiplied with the unit valued price (UVAP):
\begin{equation} EAAP_{io}=UVAP_{io}NETF_{io} \end{equation}
The following table shows the elements of the CAPRI data base as they have been arranged in the tables of the data base.
Table 2: Main elements of the CAPRI data base
| Activities | Farm- and market balances | Prices | Positionsform from the EAA | |
|---|---|---|---|---|
| Outputs | Output coefficients | Production, seed and feed use, other internal use, losses, stock changes, exports and imports, human consumption, processing | Unit value prices from the EAA with and without subsidies and taxes | Value of outputs with or without subsidies and taxes linked to production |
| Inputs | Input coefficients | Purchases, internal deliveries | Unit value prices from the EAA with and without subsidies and taxes | Value of inputs with or without subsidies and taxes link to input use |
| Income indicators | Revenues, costs, Gross Value Added, premiums | Total revenues, costs, gross value added, subsidies, taxes | ||
| Activity levels | Hectares, slaughtered heads or herd sizes | |||
| Secondary products | Marketable production, losses, stock changes, exports and imports, human consumption, processing | Consumer prices |
