This is an old revision of the document!
Disaggregation of Nitrogen Input
Nitrogen input to fields needs to be distributed over the spatial units in a region where the crop is cultivated. For each crop, the regional nitrogen balance is given with total N inputs per N input type, an N outputs or losses per output and loss type.
We base the distribution model on a generic crop-fertilizer-response curve. Such curves have the characteristics that are desirable for the disaggregation of nitrogen input:
- higher N input leads to higher yields;
- with increasing levels of N input the yield increment decreases;
- the N ‘uptake’ is always less of N input;
- saturation, i.e. attaining about 80-90% of the maximum yield at about 100-200 kg N ha-1 yr-1
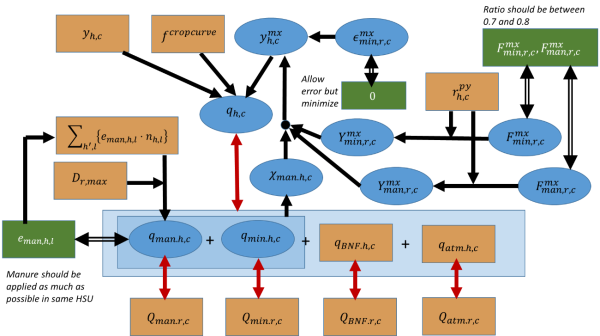
Such crop response curves ‘work’ with a maximum yield which are approached at high levels of N input. These maximum yield values are unknown. Figure below gives an overview of the approach indicating parameters, variables, and optimization rules.
Figure 43: Schematic overview of the Nitrogen disaggregation model


Source: own illustration
