This is an old revision of the document!
Table of Contents
Baseline Generation
On forecasts in simulation models
The purpose of a baseline is to serve as a comparison point or comparison time series for counterfactual analysis. The baseline is interpreted as a projection in time covering the most probable future development of the European agricultural sector under the status-quo policy and including all future changes already foreseen in the current legislation.
Conceptually, the baseline should capture the complex interrelations between technological, structural and preference changes for agricultural products world-wide in combination with changes in policies, population and non-agricultural markets. Given the complexity of these highly interrelated developments, baselines are in most cases not a straight outcome from a model but developed using a combination of trend analysis, model runs and expert consultations. In this process, model parameters such as elasticities and exogenous assumptions, e.g., technological progress captured in yield growth, are adjusted in order to achieve plausible results (as regarded by experts, e.g. European Commission projections). It is almost unavoidable that the process is somewhat intransparent.
The kind of baseline process described above is not specific to CAPRI, but is found also in other large scale modelling projects. Two typical examples are discussed here.
- In the case of the Aglink modelling system of the OECD, questionnaires are sent out to the OECD Member States covering all endogenous and exogenous variables of Aglink. The Member States fill in time series regarding the future developments for their respective countries. The projections reported by the member states may themselves stem from country specific model baselines, expert consultations, trend analyses or other sources – in many cases, their provenience is not known in detail. The OECD then sets the constant terms in all behavioural equations of Aglink so that the country modules would exactly recover the values for the endogenous variables for that country found in the questionnaires at the values assigned to the exogenous variables. Clearly, as the countries fill their questionnaires without knowing about the future expectations of other OECD Members, the expectations of the different teams e.g. regarding imports/exports or world market prices may differ and lead to values at country level which are mutually not compatible when linked globally together in the modelling framework. To eliminate such differences, the OECD will repeatedly start Aglink to generate technically compatible results and receive comments on these runs which will lead to updated data in the questionnaires and thus new shift terms in the behavioural equations.
- The second example is that of FAPRI model, where a so-called melting down meeting is organised where the modellers responsible for specific parts of the system come together with market experts. Results are discussed, parameters and assumptions changed until there is consensus. Little is known about how the process works exactly, but both examples underline the interaction between model mechanisms and ex-ante expectations of market experts.
As is the case in other agencies, the CAPRI baseline is also fed by external (“expert”) forecasts, as well as by trend forecasts using data from the national ‘COCO’ and regionalized CAPREG databases (Chapters 3.2 and 3.3). The purpose of these trend estimates is, on the one hand, to compare expert forecasts with a purely technical extrapolation of time series and, on the other hand, to provide a ‘safety net’ position in case no values from external projection are available. Usually the projections for a CAPRI baseline are a combination of expert data (e.g. from FAO, European Commission, World Bank, other research teams and even private entreprises) and simple statistical trends of data contained in the CAPRI database.
Overview of CAPRI baseline processes
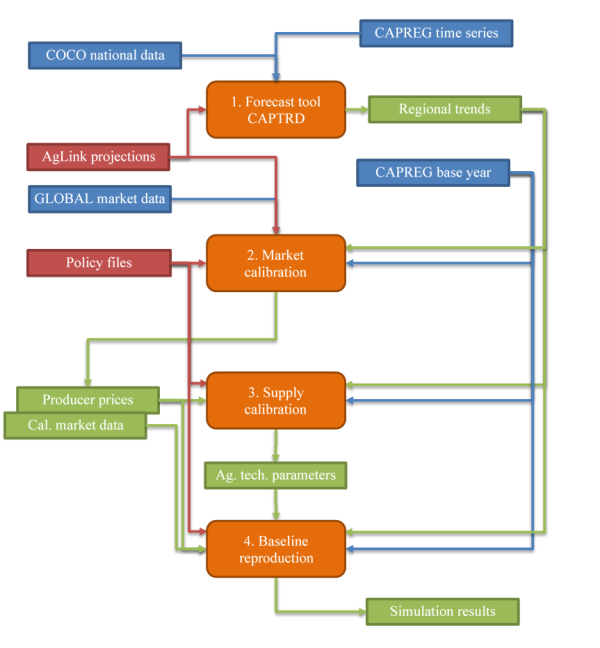
The creation of a baseline in CAPRI is considered a “workstep” in the GUI, and it consists of three distinct tasks. In addition to those three tasks, the modeller will usually want to perform a simulation of “no change” to reproduce the calibrated baseline with the model. Figure below illustrates the principal data flows involved in the baseline process. Each step is further described in a separate section of this chapter.
Figure 10: Overview of CAPRI baseline process
The forecast tool CAPTRD uses the consolidated national and regional time series from COCO and CAPREG together with external projections from the AgLink model. The result is a projection for the key variables in the agricultural sector (activity levels and market balances) of all regions in the supply models (EU+) that is consistent with the supply model equations.
- Next task is the market model calibration. That task uses the same AgLink projections, complemented with the harmonized trade database GLOBAL (see section 3.5), the baseline policy files, the regional data for the base year (CAPREG) and the regional trends coming from CAPTRD. The output includes a market data set that is consistent with the regional trends, with calibrated parameters to steer behavioural functions, and adds producer prices to be used by the supply models.
- The third task is the calibration of the supply models. This step also uses the regional data base, regional trends, and policy files, and calibrates various technical and behavioural economic parameters of the supply models so that the projected regional production is the optimal production at the producer prices coming from the market model calibration.
- Finally, the modeller typically wants to perform a simulation using all the calibrated parameters and projected data. The purpose is twofold: to verify that the calibration of the baseline worked as intended and to generate all reports for inspection in the GUI.

