| Both sides previous revisionPrevious revision | Next revisionBoth sides next revision |
| capri:concept:spatyields [2011/04/11 09:37] – gocht | capri:concept:spatyields [2011/04/11 09:37] – external edit 127.0.0.1 |
|---|
| | <HTML> |
| | <div id="content"><!-- Start Inhalt --> |
| |
| | |
| | |
| | <div class=rightwindow> |
| | |
| | |
| | |
| | |
| | |
| | |
| | <H2><a class="intext" HREF="/dokuwiki/doku.php?id=capri:concept:spatialdownscaling">Agricultural land use and environmental indicators at 1x1 km grid resolution</A><BR> - Yields and Irrigation share</H2> |
| | |
| | |
| | |
| | <hr style="color: 'blue'; height: '2'; text-align: 'left';"> |
| | |
| | Main Contributors: Wolfgang Britz and Gunter Wriedt<BR> |
| | |
| | GIS processing of MARS yields: Renate Koble and Giulio Marchi |
| | |
| | <hr style="color: 'blue'; height: '2'; text-align: 'left';"> |
| | |
| | <P>The <B>crop yields</B> are estimated based on estimates of water limited and non-water limited yields, courtesy of the JRC's |
| | |
| | <a class="intext" HREF="http://www.marsop.info/scripts/mars.exe?page=bg">MARS</a> project, and per grid cell reported as the |
| | |
| | average of the water limited yield times unity minus the estimated irrigation share for that crop in the pixel cluster plus the non-water |
| | |
| | limited yields times the estimated irrigation share. A statistical estimator ensures that the average yields as reported in regional agricultural statistics from Eurostat are recovered.</P> |
| | |
| | |
| | |
| | |
| | |
| | <div style="float:right;padding:20px;padding-right:0px"> |
| | |
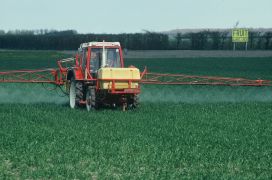
| | <a href="images\IRR.jpg"><img style="text-decoration: none;border: none;color: white;" src="images\IRR.jpg" width="400px"/></a> |
| | |
| | </div> |
| | |
| | |
| | |
| | <P>The <B>irrigation shares</B> and yields per crop and 1x1 km cell cluster are statistically estimated |
| | |
| | based on a Highest Posterior Density estimator, which ensures the following conditions:</P> |
| | |
| | <UL> |
| | |
| | <LI><P>The total irrigated area at NUTSIII/NUTSII region reported in the 1999 Farm Structure Survey is recovered</P></LI> |
| | |
| | <LI><P>The area weighted average yield per 1x1 km grid cell and crop is identical to the yield found in regional statistics</P></LI> |
| | |
| | <LI><P>Average yield per 1x1 km grid cell and crop are a weighted average of the non-irrigated and irrigated potential yields from MARS, multiplied with an identical scaling factor</P></LI> |
| | |
| | </UL> |
| | |
| | <P>Given the fact that there are more variables to estimate (irrigation shares per crop and <A HREF="/dokuwiki/doku.php?id=capri:concept:HSMU">HSMU</A>, scaling factors for yields per region), the statistical estimator picks the most probable |
| | |
| | combination based on minimizing deviations from given information:</P> |
| | |
| | <UL> |
| | |
| | <LI><P>The reported or average irrigation shares at NUTS II level for selected crops. Where no shares had been reported, those had been estimated based on regression models based |
| | |
| | the reported average irrigation shares, and using climate data as explanatory variables.</P></LI> |
| | |
| | <LI><P>The average irrigation shares per HSMU, defined from the global irrigation map of FAO</P></LI> |
| | |
| | <LI><P>A preferred scaling factor of unity for the crop yields</P></LI> |
| | |
| | </UL> |
| | |
| | |
| | |
| | <hr style="color: 'blue'; height: '2'; text-align: 'left';"> |
| | |
| | <H3>More information</H3> |
| | |
| | <P class="pubparagraph"><span class="pubAuthor">Britz W. and Wriedt G.</span>:<BR> |
| | |
| | <I><a HREF="..\docs\yields.pdf" class="intext">Pan-European Estimation of crop specific yields and irrigation shares at 1x1 km grid, JRC, 2007 (pdf, foils)</a></I></p> |
| | |
| | <BR> |
| | |
| | |
| | |
| | <font size=1>Last Updated:Tuesday, October 28, 2008 |
| | |
| | </font> |
| | |
| | </div><!-- Ende RightWindow --> |
| | |
| | </div><!-- Ende content --> |
| | </HTML> |